

Home prices in 2026 are tracking roughly flat on a national basis, mortgage rates are easing only modestly from recent levels, and commercial investment activity is picking up after a slow stretch. The main forces at play are stubborn mortgage rates, a homeowner "lock-in effect" that keeps resale inventory tight, and sharp differences between metros gaining population and those with oversupply.
TL;DR:
- Buyers should get preapproved 30 to 60 days before searching; builders may offer rate buydowns or closing cost credits instead of lowering list prices.
- Sellers should set realistic prices from the start and budget for longer marketing periods, because overpricing can leave listings stale.
- Compare local inventory, permits, and job growth before making offers, since national price averages can hide major differences between metros.
- The Federal Reserve estimates a housing shortfall of 2 million to 5.5 million homes, so lower mortgage rates alone cannot resolve affordability.
- Investors should favor industrial assets and well located multifamily, while stress testing rent assumptions in Sun Belt metros absorbing new apartment supply.
Table of Contents
- National market snapshot and headline forecasts
- Housing supply and construction: starts, unsold inventory, and constraints
- Mortgage rates and Fed policy: the mechanism and expected path
- Affordability and rental-market trends in 2026
- Regional divergence: which metros outperform or lag and why
- Commercial real estate outlook: sector-by-sector expectations
- Practical guidance: checklists for buyers, sellers, investors, and agents
- What to expect in the months ahead and how costs will move
- How demographic shifts and migration are reshaping 2026 demand
- How proptech and virtual tools are changing the home search
- Government policies and tax incentives shaping the 2026 housing market
- Emerging buyer preferences and lifestyle trends shaping demand
- My read on where this market is headed
- RealtiFy: a streamlined path for acting on the 2026 outlook
- FAQ
- Sources
National market snapshot and headline forecasts
The national picture for 2026 is one of stabilization rather than a dramatic swing in either direction. J.P. Morgan Global Research expects home prices to stay roughly flat in 2026 under its base case, with the possibility of modest increases in 2027 depending on how rates and inventory move. That flat-price forecast aligns with a market where buyers have more negotiating room than they did a few years ago, but sellers are not facing outright price declines in most regions.
On the construction side, the NAHB's 2026 housing outlook describes a posture of "cautious optimism," projecting modest single-family construction gains alongside mortgage rates expected to hold slightly above 6% for the year. Builders are adjusting to this environment with some changes, which matters for anyone tracking new-home supply.
A few data points anchor the national baseline for 2026:
- Home prices are projected to stay close to flat nationally, per J.P. Morgan's housing outlook.
- Mortgage rates are expected to hold slightly above 6% through the year, according to NAHB's February 2026 outlook.
- Single-family construction is forecast to remain relatively stable with only slight changes rather than a sharp rebound or further contraction.
- Commercial real estate investment activity is expected to increase in 2026 after a slower prior stretch, though sector performance will diverge.
NAHB's builder survey points to mortgage rates slightly above 6% for 2026, a level that keeps monthly payments elevated even as home price growth cools. For buyers who have been waiting for a dramatic rate drop, this suggests the wait may need to be measured in basis points rather than full percentage points.
Housing supply and construction: starts, unsold inventory, and constraints
Supply remains the structural issue underneath every other housing trend in 2026. The State of the Nation's Housing 2026 report from Harvard's Joint Center for Housing Studies documents slowing household growth alongside rising unsold new-home inventory and softening construction activity through 2025. That combination, more unsold homes paired with builders pulling back, signals a market working through excess supply in certain price points and regions rather than a uniform shortage everywhere.
Several factors are keeping construction from accelerating to meet long-term housing needs:
- Skilled labor shortages continue to slow build timelines across many markets.
- Local permitting and zoning rules add time and cost before a shovel ever hits the ground.
- Elevated material and financing costs squeeze builder margins, especially on entry-level product.
Builders are responding by changing what they build rather than simply building less. Smaller floor plans, attached townhomes, and build-to-rent communities have become more common as developers chase buyers and renters who are priced out of larger single-family homes. These product shifts are a direct response to the affordability pressure documented in the Harvard JCHS report, and they are likely to shape what inventory looks like in most metros through 2026.
Pro Tip: If you're house hunting in 2026, ask your agent for builder-incentive data in your target zip code: many builders are offering rate buydowns or closing-cost credits instead of cutting list prices outright.
Mortgage rates and Fed policy: the mechanism and expected path
Mortgage rates sit at the center of nearly every other trend covered here, and the path for 2026 looks like gradual stabilization rather than a sharp decline. NAHB's outlook pegs rates slightly above 6% for the year, a level that keeps monthly payments high relative to the ultra-low-rate era but represents an improvement from recent peaks.
The Federal Reserve's own commentary frames the broader affordability problem clearly. In a September 2026 speech, Federal Reserve Governor Barr described shelter costs as a major ongoing affordability issue, noting that affordability monitors show readings well below historical norms and that housing supply shortfalls are estimated at somewhere between 2 million and 5.5 million units depending on the methodology used.
Mortgage rates do not move in lockstep with the Fed's benchmark rate, but Fed policy shapes the broader rate environment that mortgage pricing follows:
- Fed policy decisions influence investor demand for mortgage-backed securities, which in turn affects the rates lenders offer.
- Inflation trends and labor-market data continue to drive the Fed's rate decisions throughout 2026.
- The "lock-in effect," where homeowners holding mortgages well below 6% are reluctant to sell and give up that rate, keeps resale inventory tight even when demand softens.
The Fed estimates a national housing shortfall of 2 to 5.5 million units, depending on method, according to Governor Barr's September 2026 remarks. That range underscores why rate relief alone will not solve affordability: supply has to catch up too.
Affordability and rental-market trends in 2026
Affordability remains strained even as price growth cools, because the math of a 6%-plus mortgage rate against still-elevated prices leaves many buyers priced out. The Federal Reserve's affordability monitors, cited in Governor Barr's 2026 speech, show readings well below historical levels, meaning the typical household faces a tougher path to homeownership than in past decades.
Renters are navigating a related but distinct set of pressures. With homeownership out of reach for many, rental demand has stayed resilient, and the cost burden on renters mirrors the strain that buyers face on the ownership side. For renters trying to qualify for a new lease, understanding standard rental application requirements, including income-to-rent ratios and identification documentation, has become a bigger part of the search process as competition for well-priced units persists.
Who feels this most:
- First-time buyers face the steepest climb, since they lack existing home equity to offset today's rates and prices.
- Renters in high-demand metros continue to see tight vacancy and limited negotiating leverage.
- Lower- and middle-income households are the most cost-burdened group on both the buying and renting sides, per the Fed's affordability commentary.
Policy responses are underway at multiple levels of government, including efforts to reduce construction barriers, but the scale of the shortfall described by the Fed means affordability relief will likely arrive gradually rather than all at once.
Regional divergence: which metros outperform or lag and why
National averages flatten out a story that looks very different from one metro to the next. Some markets are absorbing new supply easily because population and job growth keep pace with construction, while others, particularly fast-building Sun Belt metros, are seeing unsold inventory pile up faster than demand can soak it up. The Harvard JCHS findings on rising unsold new-home inventory are not evenly distributed: they concentrate in markets where builders ramped up production during the pandemic-era boom and are now adjusting to slower buyer traffic.
A few patterns to watch when comparing local markets:
- Metros with constrained land supply and steady in-migration tend to hold price levels better than fast-growing markets with abundant buildable land.
- Markets that over-built relative to local job growth are more likely to see builder price incentives and longer days-on-market.
- Affordability-driven migration, buyers leaving expensive coastal metros for lower-cost regions, continues to support demand in a handful of mid-size cities.
- Local permit and completion data, available through Census construction reports, offer an early signal of which metros are approaching oversupply before price data catches up.
Reading your own metro's inventory and permit trends alongside national forecasts gives a far more useful picture than relying on national headlines alone, since a "flat national price" forecast can mask double-digit swings in either direction at the local level.
Commercial real estate outlook: sector-by-sector expectations
Commercial real estate is set up for a year of recovering capital flows but uneven sector performance. Institutional forecasts broadly agree that overall investment activity should rise in 2026 compared with the prior slower stretch, even as individual property types follow very different trajectories.
- Office space remains under pressure in most markets, with conversion to residential or mixed use gaining traction in buildings that cannot attract tenants at pre-pandemic rents.
- Industrial real estate continues to benefit from steady demand tied to logistics and e-commerce distribution, though growth has moderated from its peak years.
- Multifamily is working through a wave of new deliveries in several Sun Belt metros, which is temporarily softening rent growth and absorption even as longer-term demand fundamentals stay intact.
- Retail has been more resilient than expected, with well-located grocery-anchored and mixed-use centers outperforming older enclosed malls.
For investors weighing where to deploy capital in 2026, this sector divergence matters more than the headline investment-activity increase. Industrial and well-located multifamily remain the more favored plays among institutional allocators, while office requires a much more selective, asset-by-asset approach.
Practical guidance: checklists for buyers, sellers, investors, and agents
The outlook above translates into different playbooks depending on where you sit in a transaction.
- Buyers: Get preapproved 30 to 60 days before you start house hunting so you can move quickly when the right listing appears, and use builder incentives or rate buydowns to offset the slightly-above-6% rate environment.
- Sellers: Price realistically from day one rather than testing the market high, since flat national price growth means overpricing leads to longer days-on-market and stale-listing penalties.
- Sellers: Prepare for a longer marketing window than you may remember from the pandemic-era market, and budget for the realtor fee structure required under post-settlement contract disclosure rules.
- Investors: Underwrite deals assuming rates stay near current levels through 2026 rather than betting on a sharp decline, and stress-test rent assumptions against the multifamily oversupply in fast-growing metros.
- Investors: Consider diversifying into sectors like vacation rentals in strong tourism markets, where operator-first investment approaches can offset softer multifamily absorption elsewhere.
- Professionals: Use the data in this outlook to set realistic client expectations early, since clients anchored to pandemic-era price appreciation or rock-bottom rates need a reset conversation before they start searching.
Pro Tip: Buyers and sellers alike should ask their agent to pull local months-of-supply data, not just national headlines, before setting a price or an offer strategy.
What to expect in the months ahead and how costs will move
The near-term drivers for the rest of 2026 are mortgage rates, inventory levels, and how quickly builders work through unsold stock. If rates hold slightly above 6% as NAHB projects, expect sales activity to stay subdued but stable rather than collapsing, since most homeowners with sub-6% mortgages will continue sitting out of the resale market.

Cost expectations follow a similar pattern: with prices forecast to stay roughly flat, buyers should not expect bidding wars in most markets, but they also should not expect deep discounts outside of oversupplied pockets. Construction costs remain a wildcard, since labor and material expenses that NAHB and Harvard JCHS both flag as ongoing constraints tend to pass through to new-home prices even when existing-home prices stay flat.
The most likely scenario through the rest of 2026 is a market that moves sideways nationally while individual metros see meaningful movement in either direction depending on local supply and job growth. Buyers who wait for a dramatic rate drop may be waiting past 2026, based on the current rate trajectory described in NAHB's outlook, while sellers who wait for a return to pandemic-era bidding wars are likely to be waiting even longer.
How demographic shifts and migration are reshaping 2026 demand
Household formation patterns are shifting the geography of housing demand in ways that matter more than the national price forecast alone. The Harvard JCHS research on slowing household growth points to a demand picture that is cooling overall, even as certain demographic groups, including younger renters delaying homeownership and older homeowners aging in place, reshape what gets built and where.
Migration continues to favor lower-cost metros, particularly as remote and hybrid work arrangements let buyers decouple their home location from their job location. This has kept demand elevated in mid-size metros across the South and parts of the Mountain West, even as some higher-cost coastal metros see slower population growth. For investors and agents, tracking migration data alongside local permit activity gives a clearer read on which metros will see genuine demand growth versus which are overbuilding ahead of population trends.
Aging homeowners also play a growing role in supply dynamics. As more owners choose to age in place rather than downsize, the resale inventory that would normally come from life-stage transitions stays off the market longer, compounding the lock-in effect already driven by low mortgage rates.
How proptech and virtual tools are changing the home search
Technology continues to reshape how buyers, renters, and agents interact throughout the transaction process. Virtual tours and 3D walkthroughs have become standard expectations for listings rather than a premium feature, letting buyers narrow their in-person showing list before ever leaving home. This matters more in a market where days-on-market have lengthened and buyers want to move efficiently once they do start touring.
Direct messaging between buyers and agents, without routing every question through a call center or multiple intermediaries, has also become a bigger differentiator. Buyers increasingly expect to communicate directly with the agent representing a listing, verify that agent's credentials and track record, and get fast answers on pricing or availability rather than waiting on callbacks. Analytics tools that help agents and sellers understand which listings are generating real interest, versus passive views, are also becoming a standard part of how serious sellers price and market a home in a slower-moving market.
Government policies and tax incentives shaping the 2026 housing market
Federal and state policymakers have taken a more active role in addressing supply constraints heading into 2026. In March 2026, the White House announced actions aimed at removing regulatory barriers to affordable home construction, targeting the permitting and zoning delays that both NAHB and Harvard JCHS identify as persistent constraints on new supply.
These federal actions work alongside, rather than replace, local zoning authority, which remains the primary bottleneck in most metros. Local jurisdictions that have eased single-family zoning restrictions or streamlined permitting have generally seen faster construction timelines than those that have not. For buyers and investors evaluating a market's growth potential, local zoning reform activity is often a better forward indicator of future supply than any single federal policy announcement.
Property tax rates and any available first-time buyer incentives vary significantly by state and locality, so confirming the specific rules that apply in your target market with a local professional remains the safest approach before budgeting for a purchase.
Emerging buyer preferences and lifestyle trends shaping demand
Buyer priorities have shifted meaningfully from the pandemic-era rush for maximum square footage. Remote and hybrid work arrangements continue to support demand for home offices and flexible rooms, but the emphasis has moved toward efficient layouts over simply more space, partly a function of the affordability pressure documented across this outlook.
Sustainability features, including energy-efficient windows, solar-ready roofing, and lower utility costs, are increasingly factored into buyer decisions, especially as buyers weigh total cost of ownership against a mortgage payment that is already higher than it would have been a few years ago. Smaller floor plans and attached housing types, the same product shift builders are making in response to unsold inventory, also align with what a growing share of buyers are actively searching for rather than settling for.
For buyers evaluating properties with shared amenities or governance structures, understanding HOA fees and rules before making an offer has become a more routine part of due diligence, particularly for condo and townhouse buyers drawn to these product types by affordability. Reviewing key HOA documents before submitting an offer helps avoid surprises on fees or restrictions after closing.
My read on where this market is headed
My honest take after working through this data: 2026 rewards patience and local knowledge over timing the market perfectly. National headlines about flat prices and rates hovering above 6% obscure real opportunity in specific metros and property types, and the sellers and buyers who do best this year will be the ones pulling local inventory and permit data rather than reacting to national averages. Anyone active in this market, whether buying, selling, or investing, benefits from working with an agent who actually tracks these local signals and can explain what recent deals they've closed in your target area.
— Jadin
RealtiFy: a streamlined path for acting on the 2026 outlook
Finding the right property and the right agent should not require sorting through generic listings or guessing which agent actually knows your target metro. We built our platform to help you connect directly with agents and message them without intermediaries.
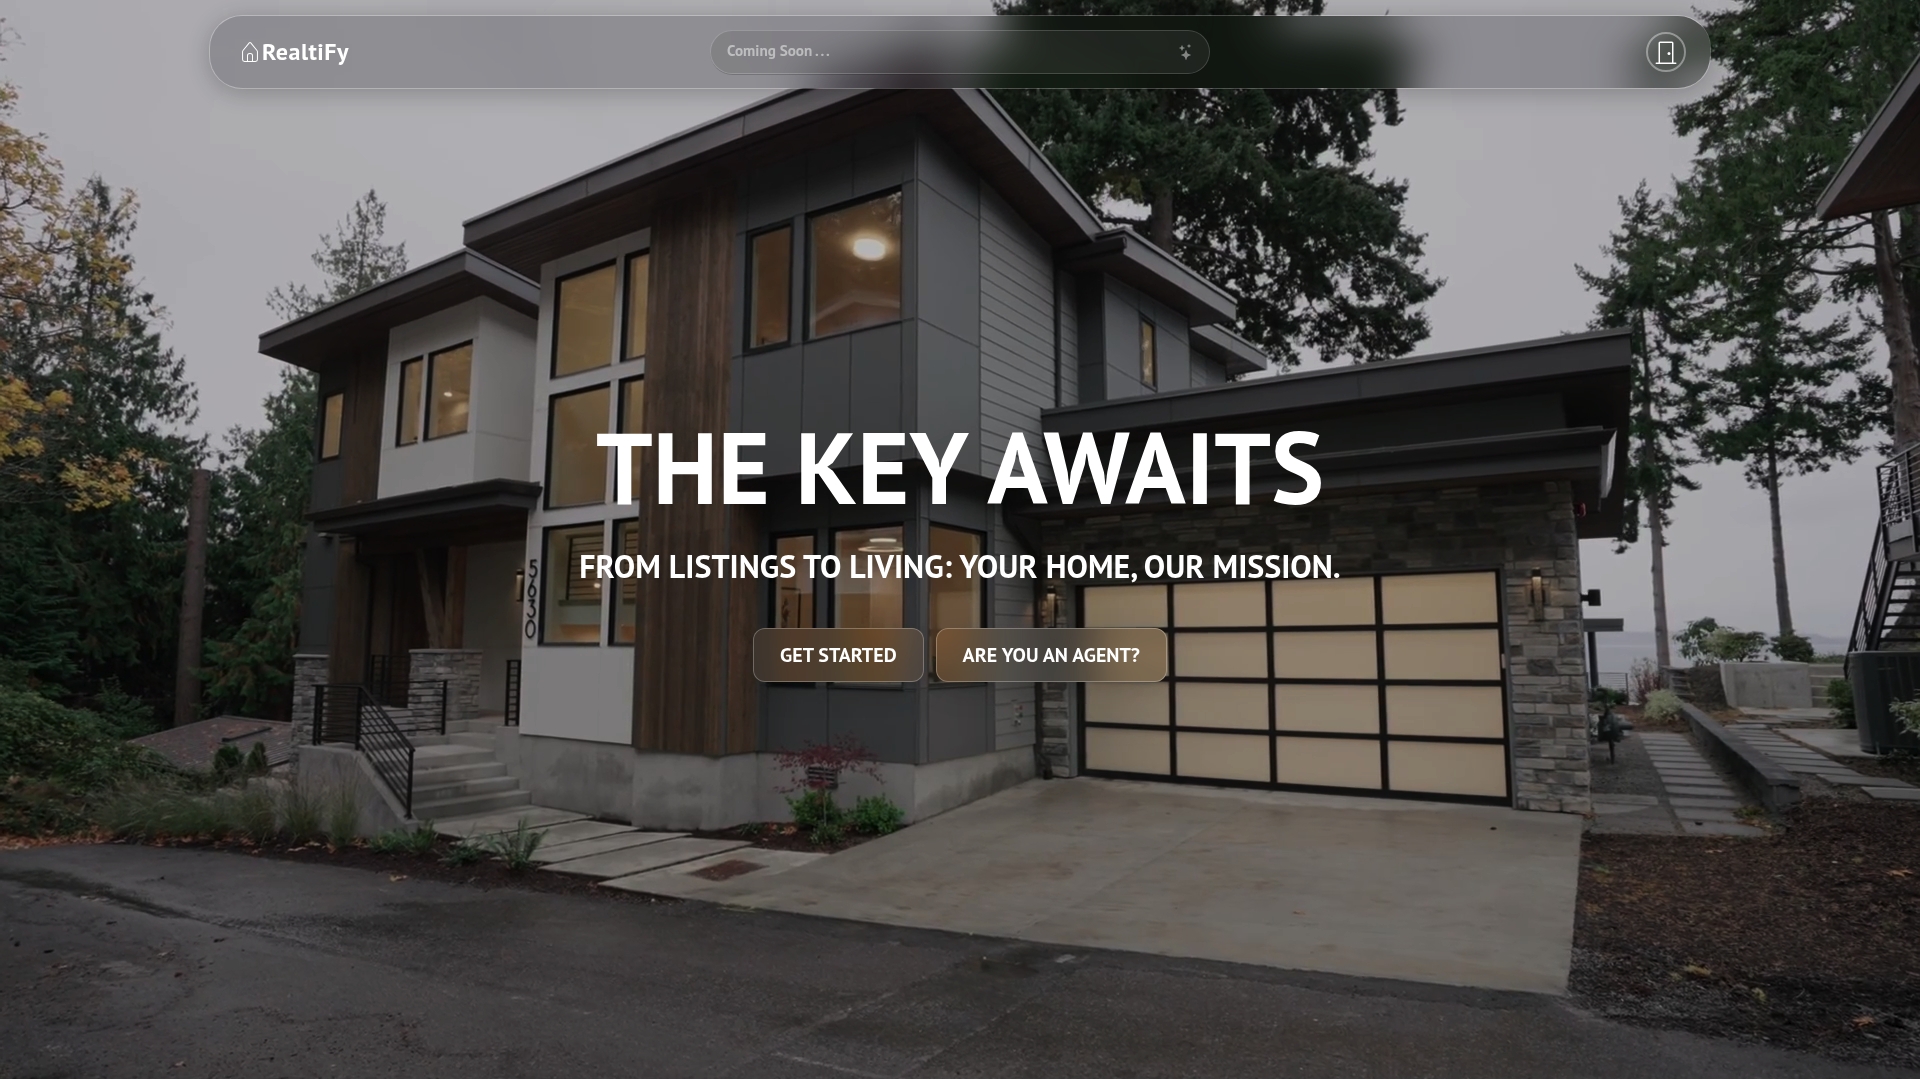
What this looks like in practice:
- Browse curated property listings matched to your search criteria rather than scrolling through every listing in a metro.
- Connect directly with agents whose credentials and experience we highlight upfront, through our vetted agent network.
- Message agents directly to get fast answers on pricing, availability, and local market conditions.
If you are ready to act on any part of this 2026 outlook, whether that means finding your next home or listing one, start browsing homes on RealtiFy today.
This article is general information, not a substitute for advice from a qualified financial advisor. Consult a qualified financial professional about your own circumstances before acting on anything here.
FAQ
Is real estate expected to go up or down in 2026?
Most institutional forecasts, including J.P. Morgan's housing outlook, point to roughly flat national home prices in 2026 rather than a sharp rise or fall. Individual metros will vary significantly, with supply-constrained areas holding steadier prices than markets that have overbuilt relative to local demand.
What is Warren Buffett saying about the housing market?
This article does not cover statements from Warren Buffett specifically, since no sourced commentary from him informs this outlook. For 2026 housing guidance, institutional sources like NAHB and the Federal Reserve offer the most directly relevant 2026 forecasts.
What is the hardest month to sell a house?
Seasonal patterns generally make the winter months, particularly late November through January, the slowest period for home sales in most U.S. markets, as buyer traffic drops around the holidays. This article's sources do not provide a specific 2026 seasonal breakdown, so sellers should confirm timing patterns with a local agent familiar with their specific metro.
Will 2026 be a good time to sell?
Sellers who prepare for a longer marketing window and understand current realtor fee disclosure rules tend to navigate the market more smoothly.
Who is most affected by 2026 housing affordability challenges?
First-time buyers and lower- to middle-income households face the steepest affordability challenges in 2026, based on the Federal Reserve's affordability commentary, since they lack existing home equity to offset elevated prices and mortgage rates. Renters in high-demand metros also face continued cost pressure as homeownership remains out of reach for many.
Sources
- 2026 Housing Outlook: Ongoing Challenges, Cautious Optimism and Incremental Gains | NAHB
- The State of the Nation's Housing 2026 | Harvard JCHS
- Speech by Governor Barr on housing | Federal Reserve
- US Housing Market Outlook | J.P. Morgan Global Research